The Dow and SP500 are testing major trendlines and this is a logical place for a failure if a rally is not in the cards. Could go either way at this point really, with fair arguments for both bulls and bears.
Here is a chart of the industrials showing the trendline resistance. The SP500 is in a similar pattern. The Nasdaq doesn't have a similar downtrendline, but closed one point above the previous June low. It needs to move decisively over this area for bulls to feel a little better.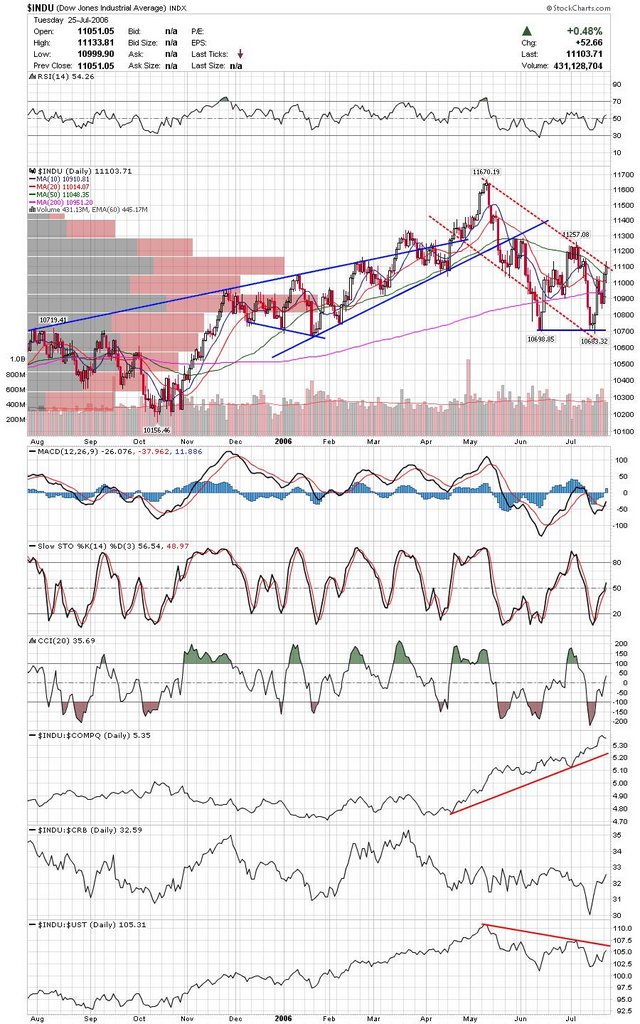 Commodities are getting interesting at these levels. The question is are commodities experiencing a normal correction or topping? Here is a chart I created that watches the link between the $crb and the Dollar index. Notice that these markets trend opposite each other. The Dollar has strengthened a little recently as the $CRB has pulled back. Notice the $crb (gold area) has been bouncing between the upper band and the 39 week average. The dollar is the green histogram and notice the possible reverse head and shoulders bottom. It will be interesting to see how this works out after the next fed meeting.
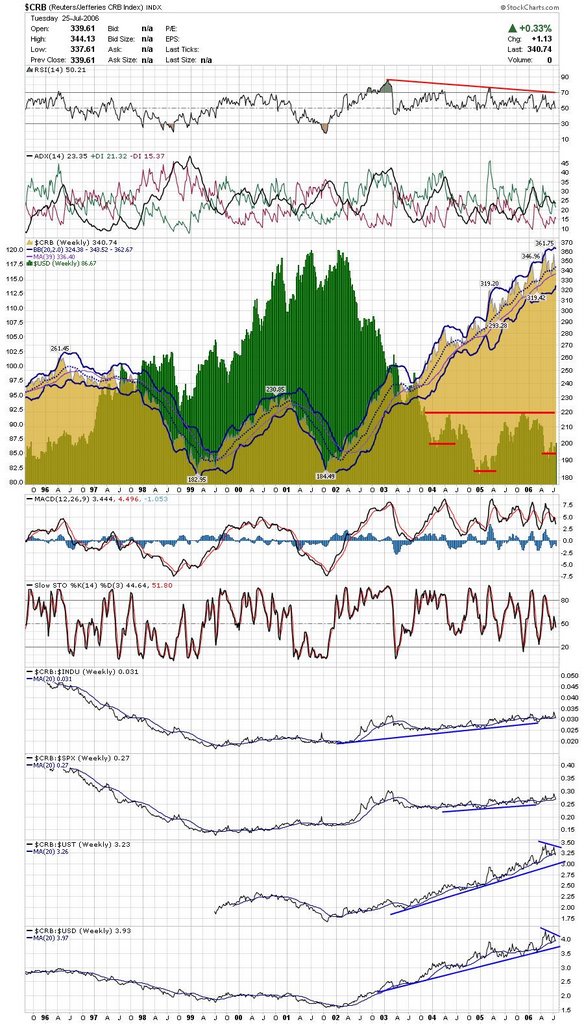 Here is a chart of the Natural Gas index. It looks like it may test the upper trendline soon.
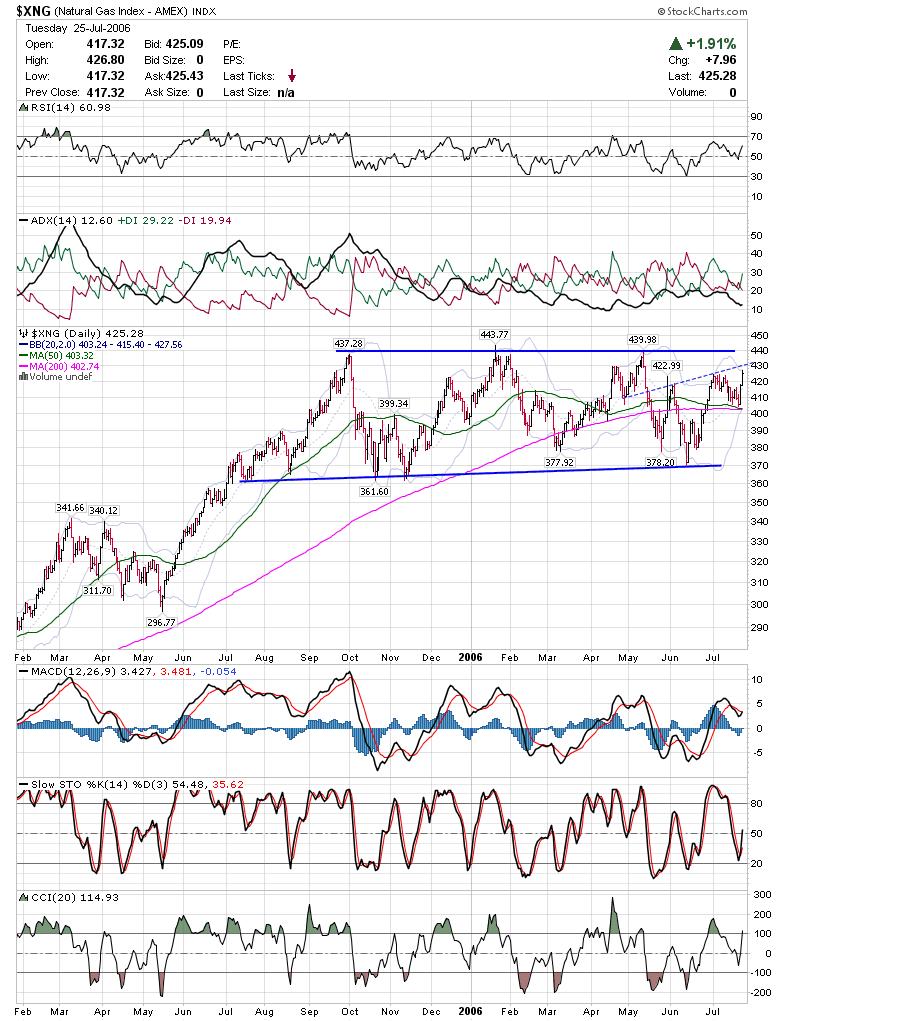 Telecom's broke out today after AT&T's bullish earnings report. I think telecoms are worth atching for the next pullback.
 GLG could go either way at this point, but I see a couple of possible bullish patterns here. If it clears this pennant type pullback, it could form a reverse head and shoulders with the neckline being near 39.
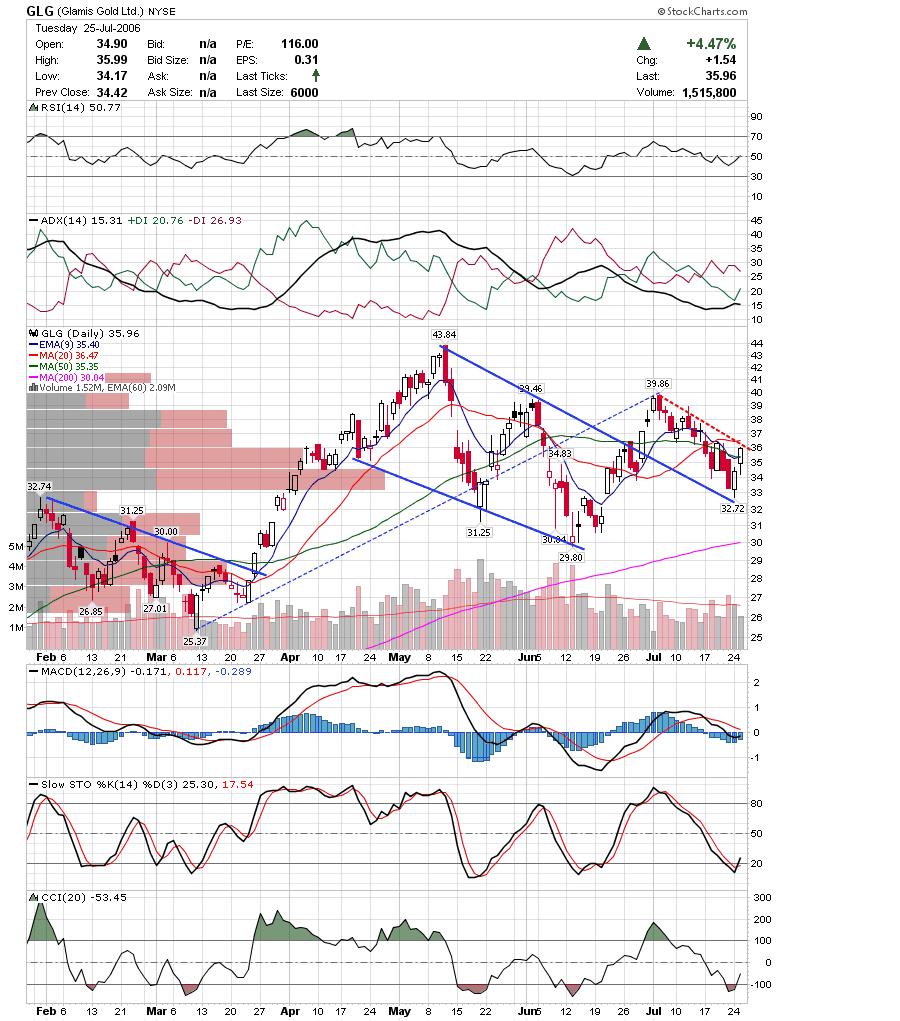 VIVO is struggling under the major trendline break.
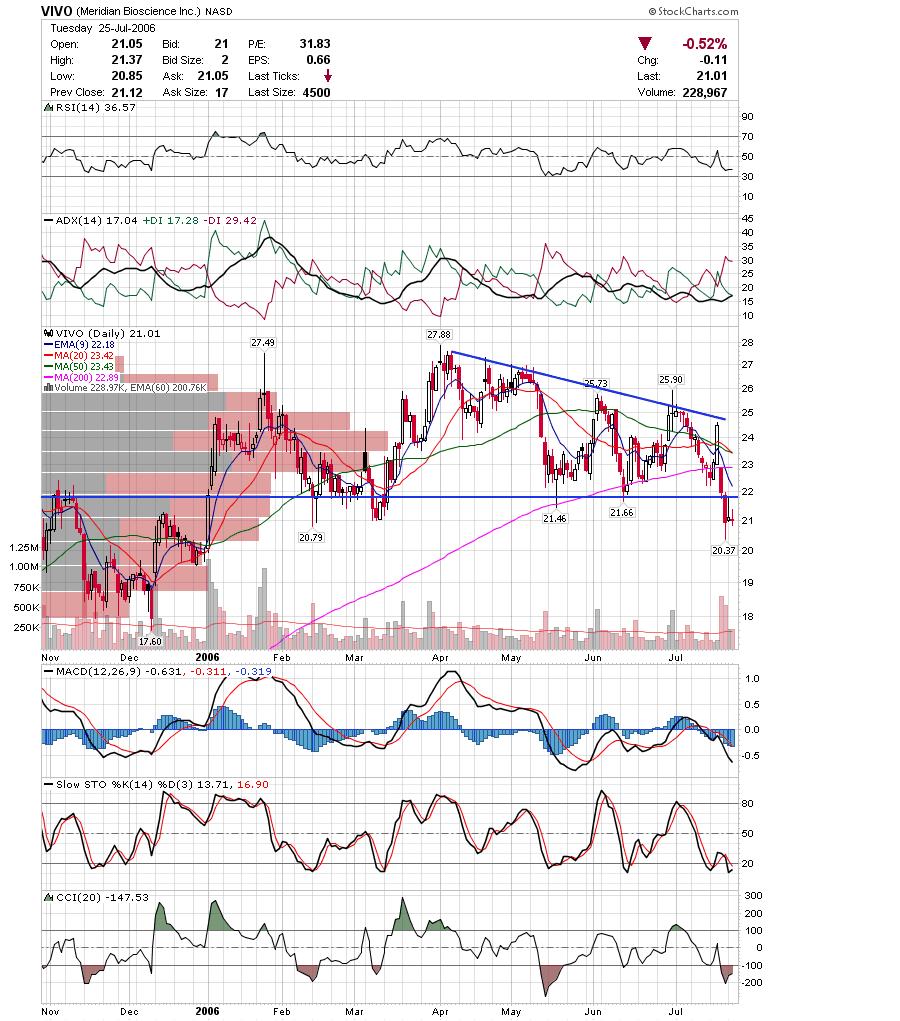 OMNI had a nice day today and may be headed towards the previous highs. I also own EGY in this area and both are looking decent.
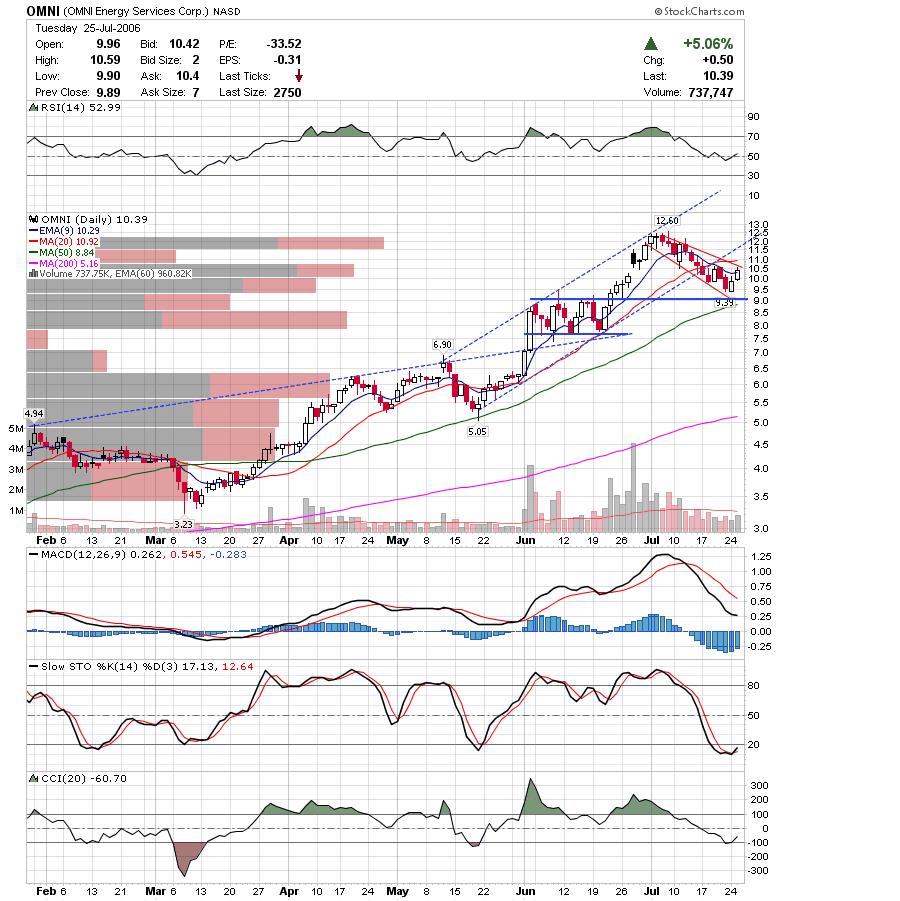 HLTH continues to chug along the previous breakout area. Aggresive traders may buy on a higher daily high. Conservative traders may wait for it to clear resistance.
 EOG looks like it may be setting up for a nice short. It is up against the 200sma and trendline resistance.
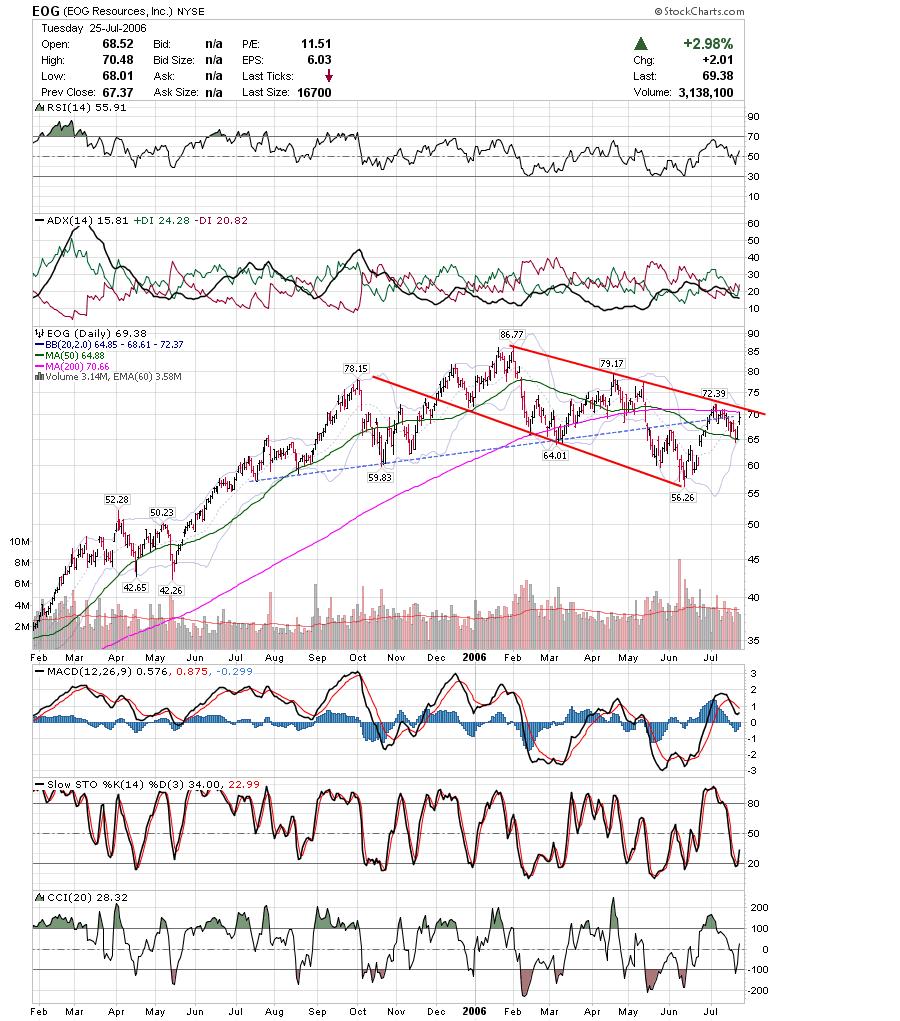 HAL is attempting to retrace some of the recent losses. I would doubt it closes above the gap. The target is listed by the red box.
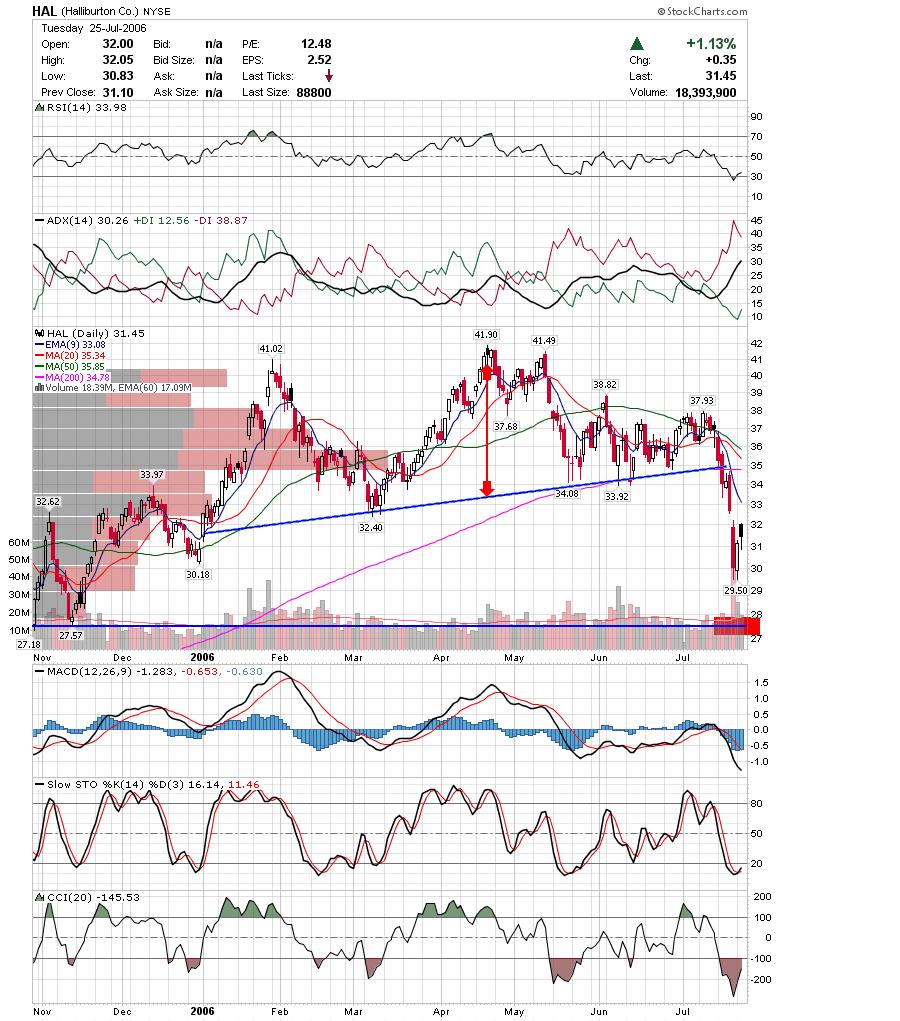
Notice I have both Shorts and Longs in the Oil / Energy sector. While I think the energy sector is in the process of topping, it looks like it is moving higher short term. I am looking to play a spread by going long on the stronger stocks and short the weaker ones, until this resolves itself.
Good Luck,
DT
Subscribe to:
Post Comments (Atom)


0 comments
Post a Comment