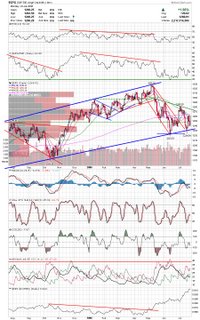
Markets had a large percentage gain today, but volume was pretty low. The markets may be putting in double bottoms here but volume will have to increase for any sustainable rally. Here is an updated SP500 chart showing the possible reverse Head and Shoulders that I mentioned last week. It looks like the neckline will at least be tested. I highlighted the Oil Sector last night as possibly topping. The OIH fund bounced off the neckline today. Although the I still believe the Energy markets to be near a "top", it looks like there is a decent chance for a retracement here, or even a near term bottom.
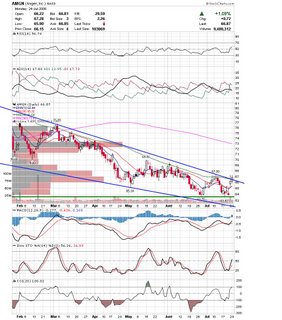
 Drug stocks are starting to perform well on a relative basis and may be the beneficiaries of a market rotation to more defensive groups. Here is a chart of AMGN clearing a long term downtrendline.
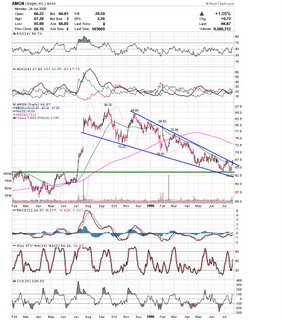
Here is a larger view showing a falling wedge which also supports a possible bottom theory by finding support near a horizontal trendline.
Careful the next couple days in case the indices are merely getting a technical bounce.
Good Luck,
DT
Subscribe to:
Post Comments (Atom)


0 comments
Post a Comment