It's a little late here and I have a bunch of charts, so I will just run through them.
Here is an updated weekly chart of the Nasdaq showing a possible support trendline under the October lows that have been breached.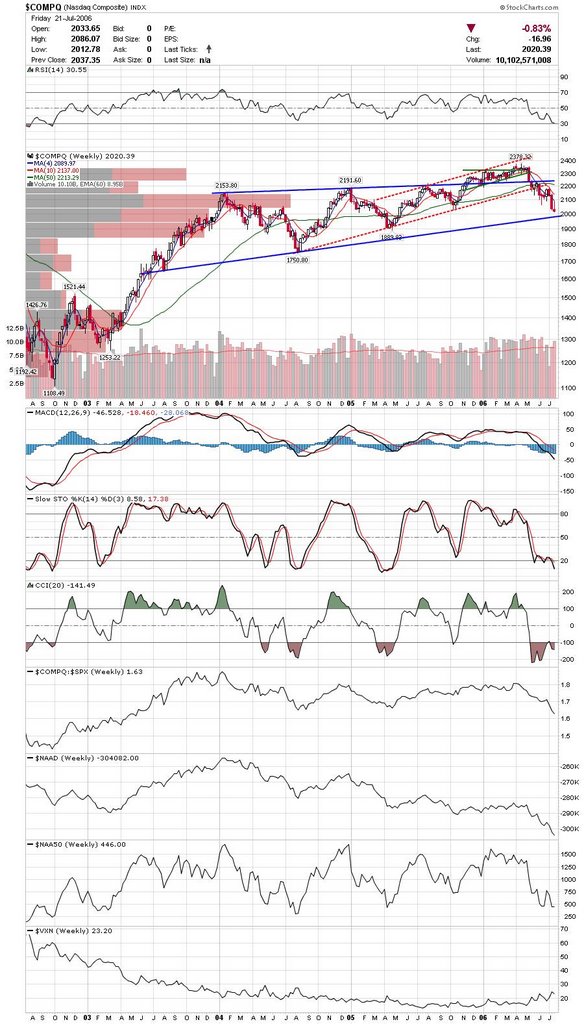 Here is a weekly chart of the Russell. The trendlines speak for themselves. One thing to notice are the ratio charts under the indicators. It looks like smallcaps may finally underperform big caps.
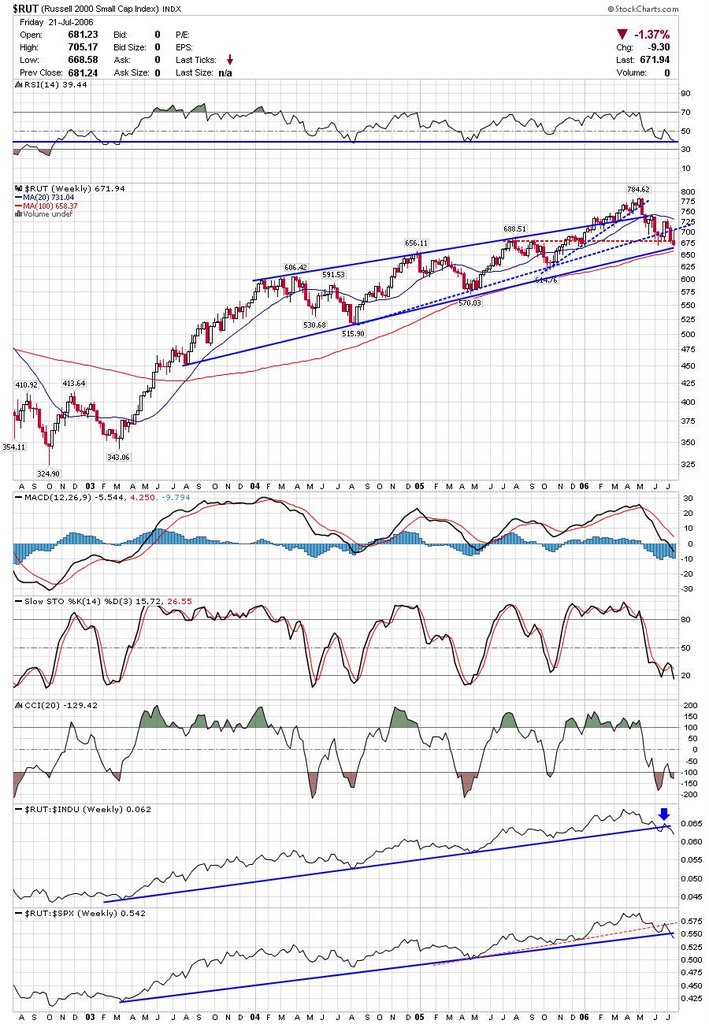 I mentioned a possible head and shoulders top in the OIH fund, and it looks like it is very close to completing if it hasn't already done so.
 Here is a weekly chart with the Oil overlayed on it. Typically, the Oil stocks peak before the commodity and notice that Oil kept rising as OIH made a lower high.
 BWP has been pulling back from resistance, but is holding up rather well as the markets have deteriorated. Watch for a breakout if markets move higher.
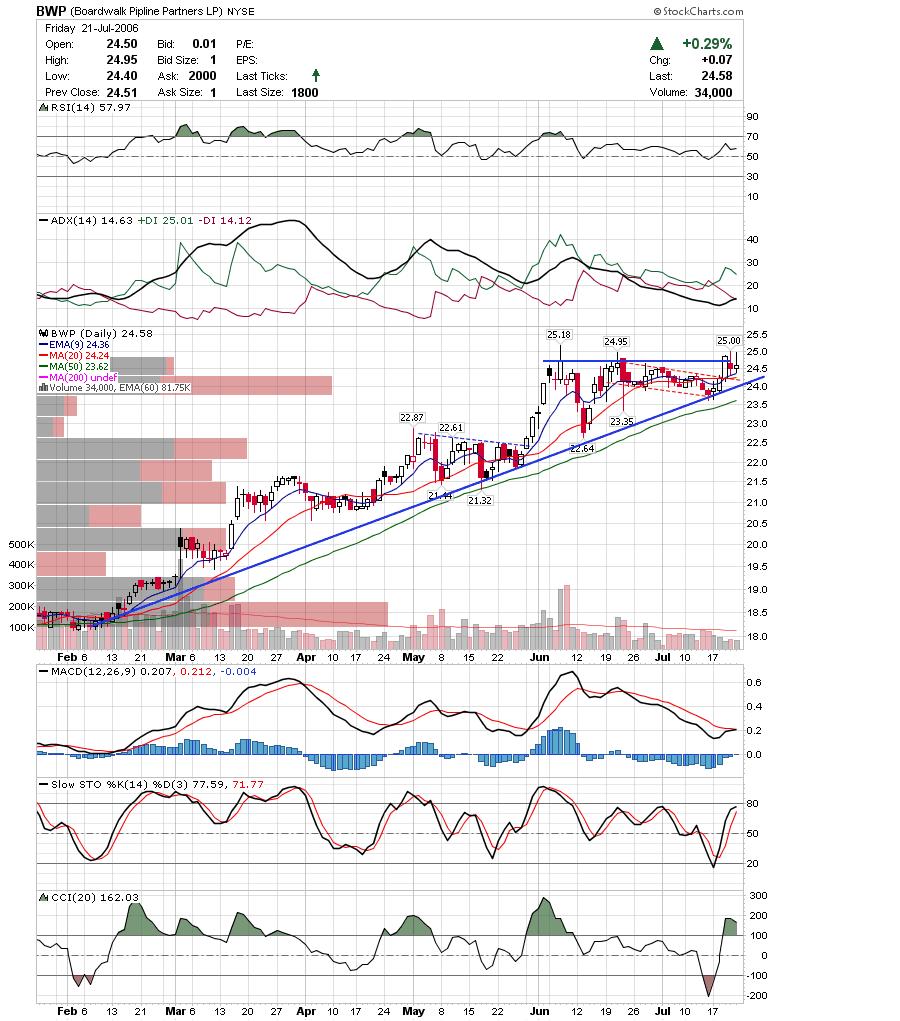 I suspected that BIDU may trade near 89 based on options Max Pain level. It closed pretty near and with a doji on support. If it makes a higher high it may be a decent buy.
 CRY has held near it's breakout area and may follow through with a bounce off the 20sma.
 Here is a chart of NTRI for those holding for earnings. This is another that was pinned to 65 for options expiration. It rose to 66 after market Friday so expect a gap up.
 JCOM fell out of an expanding trading range and may be headed to it's 200sma.
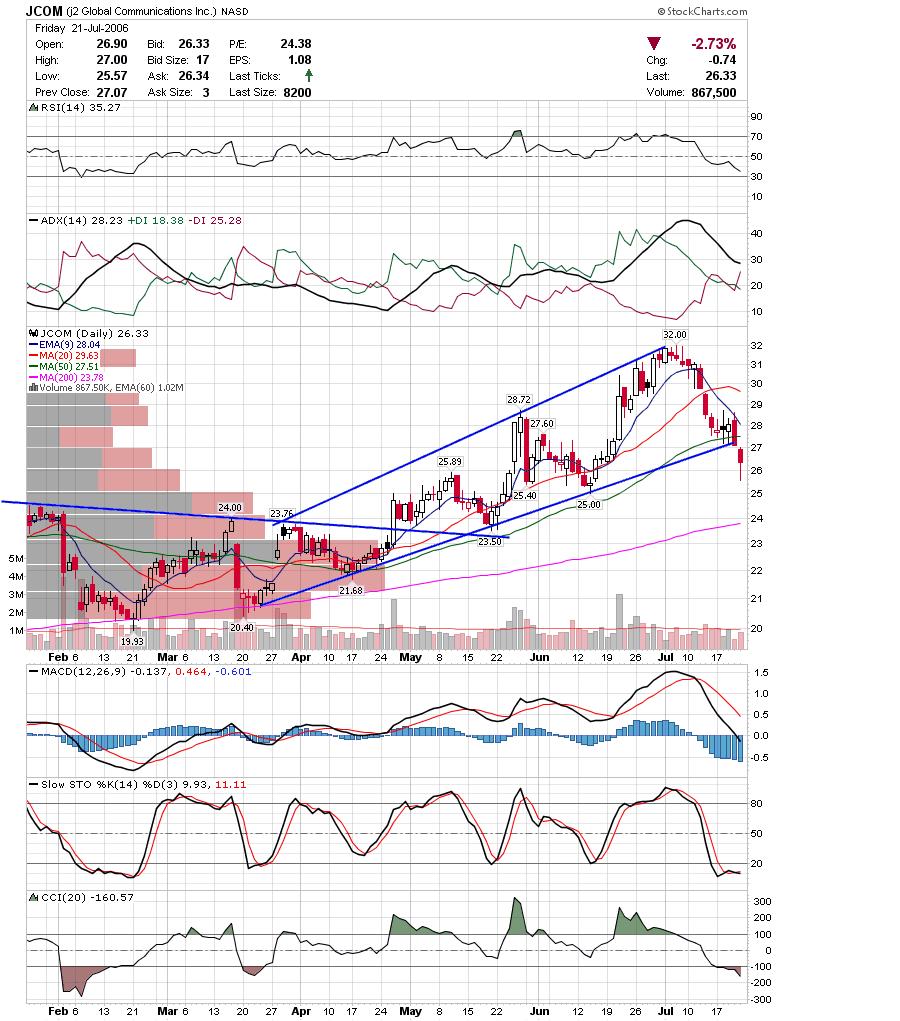 LVS broke under a risising trendline and may be headed to 50.
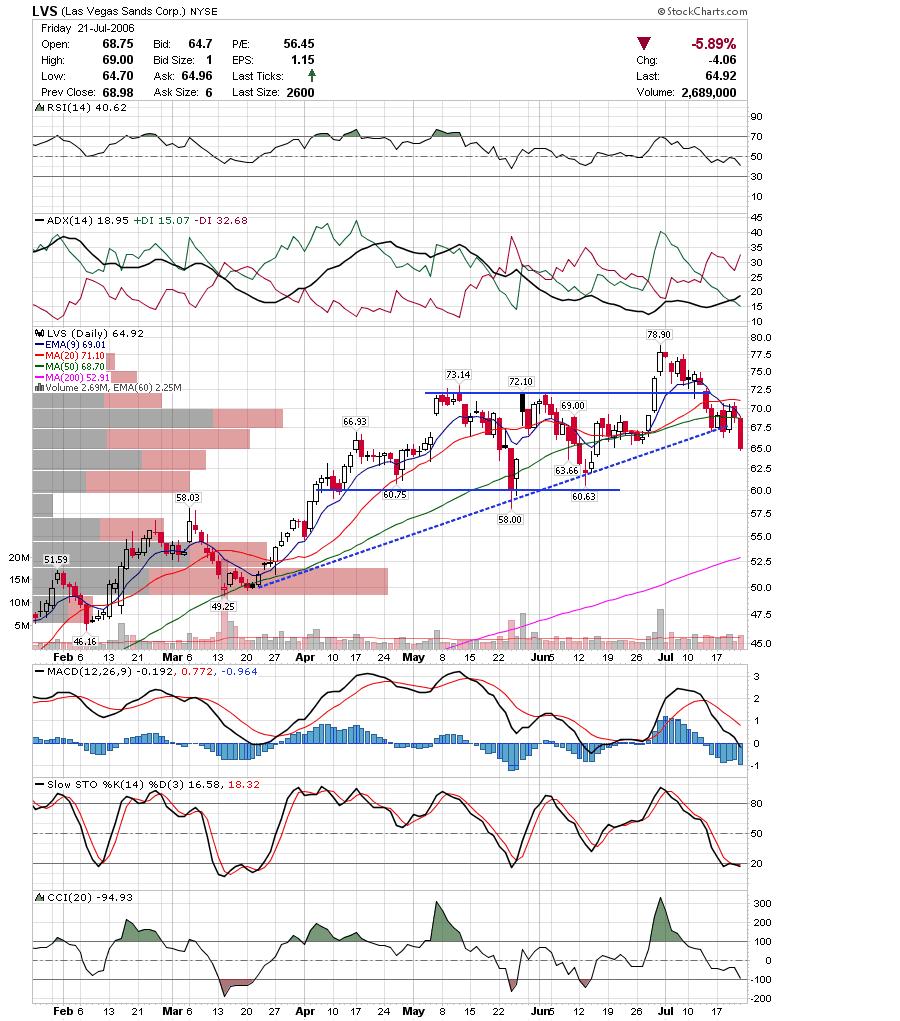 VIVO broke down friday and may be a decent short if it bounces back to test resistance.
 DRIV has been holding the previous resistance trendline as support. This could be a good trade either way, and I suspect it all depends on the near term market direction. If it breaks lower, it has a LONG way to fall.
 CACC is at critical support near 25. This is another that could go either way depending on how it deals with a major trendline.
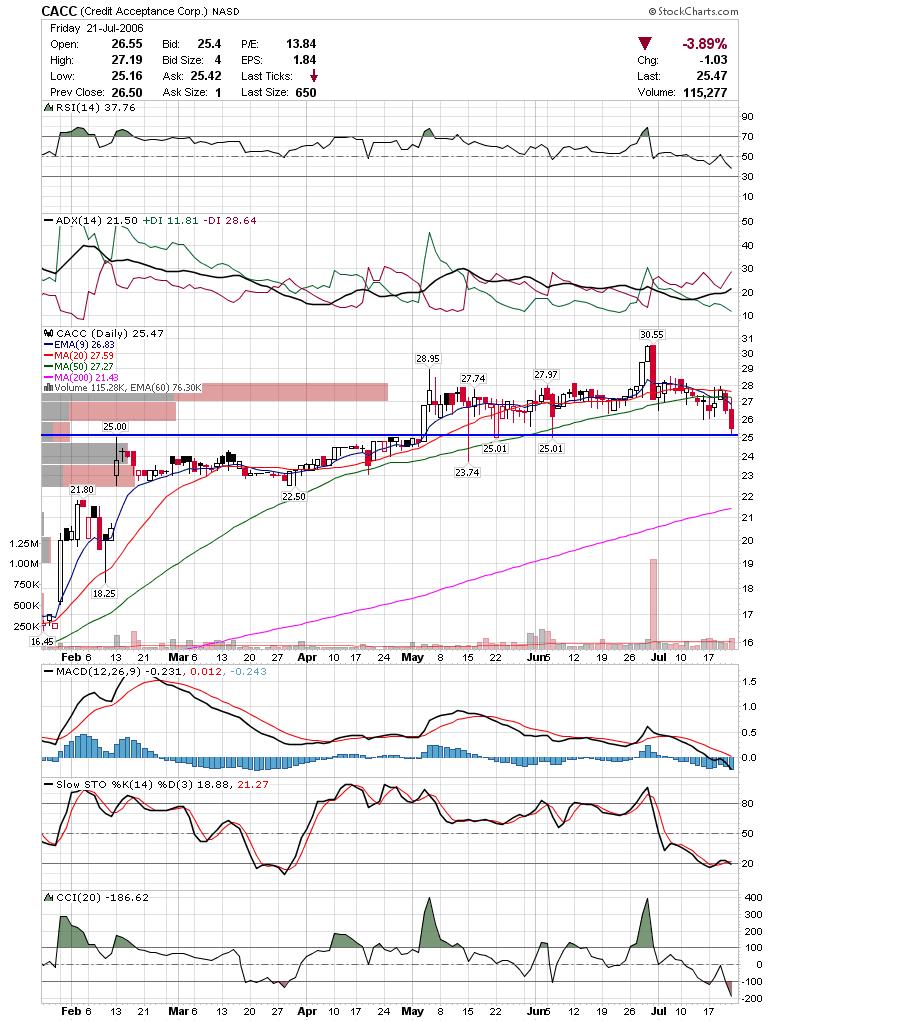 INFA is looking very good as a long play, but of course, a lot depends on the markets near term. Here is a weekly chart showing INFA bouncing off of two converging trendlines.
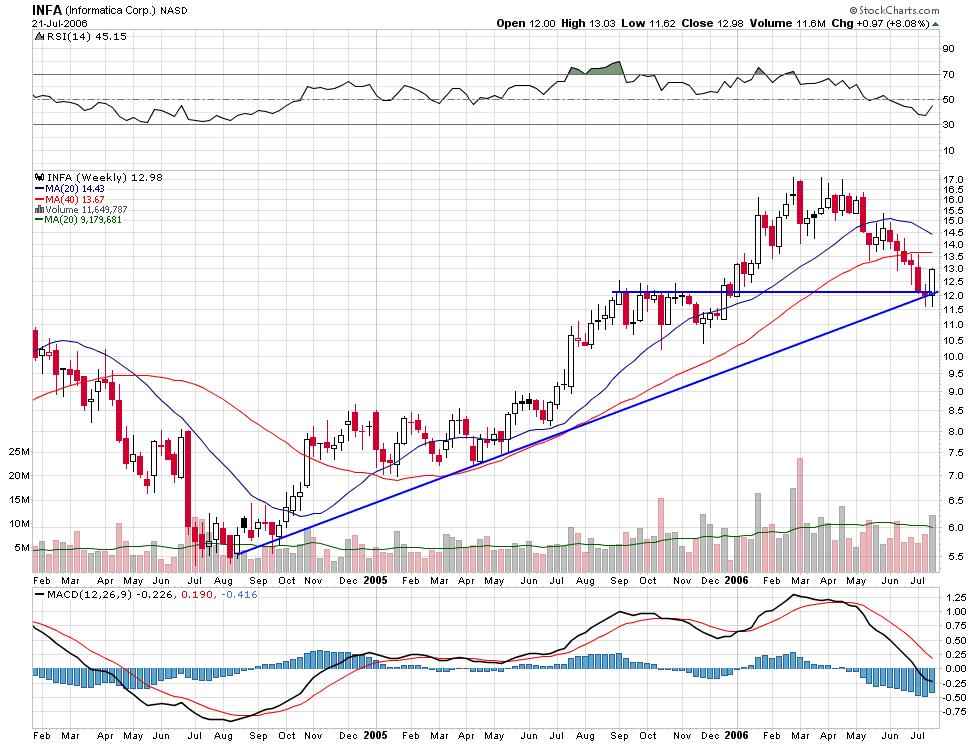 Here is the daily chart that isn't that exciting without the context of the weekly chart.
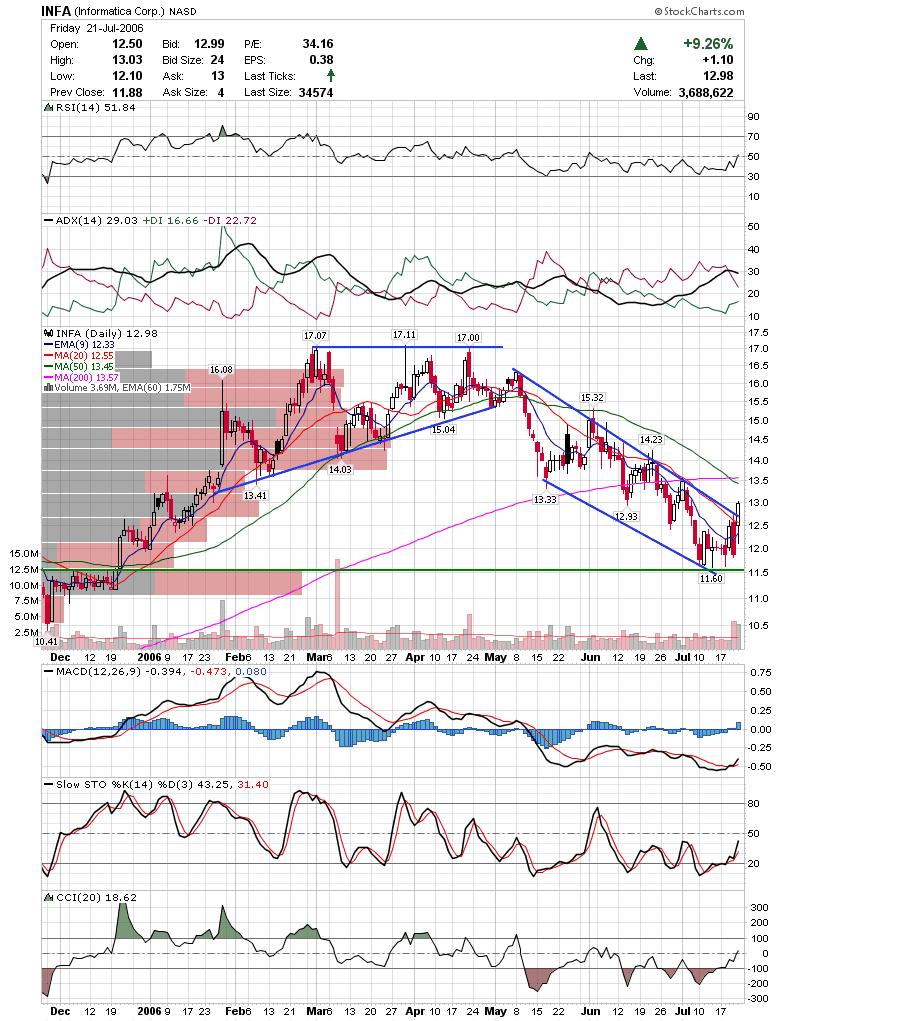 CSH is back to the breakout area. Watch to see if it bounces here.
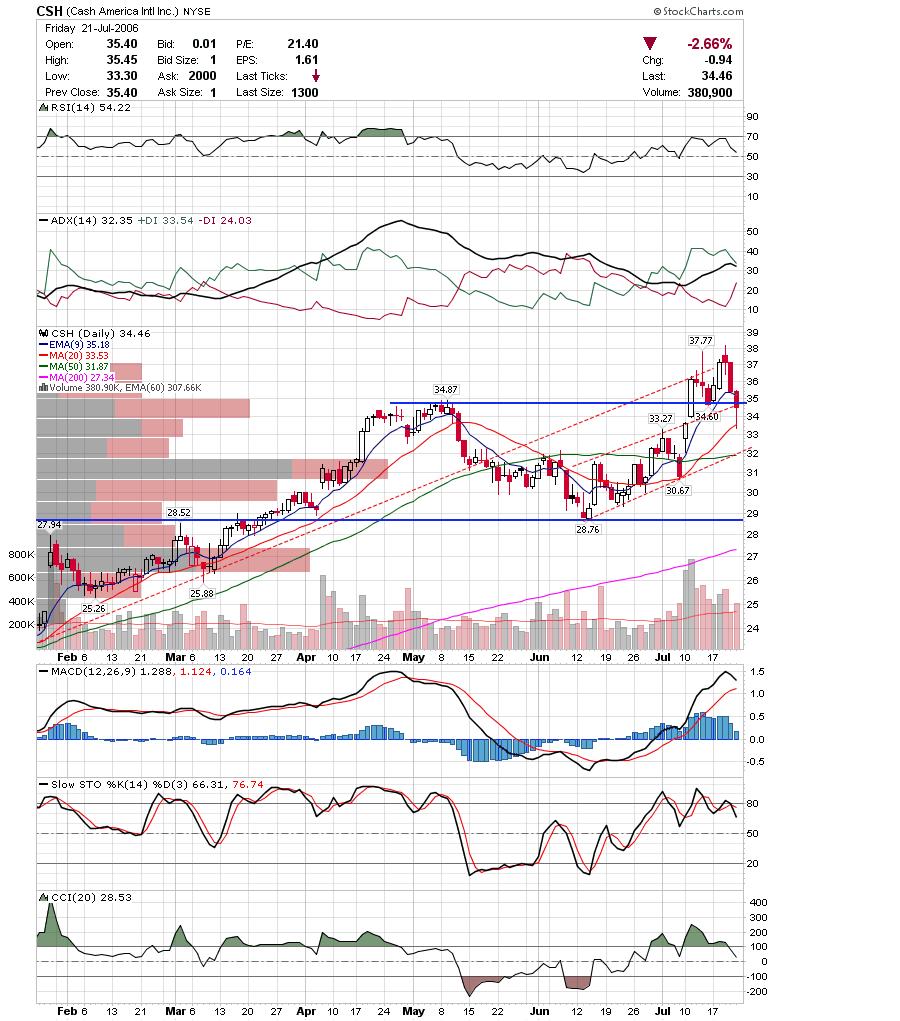
The markets are at another crucial point as there is a chance of a strong rally off a possible double bottom, or there is a chance that things will get really ugly, really fast if the Dow and SP500 follow the Nasdaq lead in making new lows. Trade Carefully,
DT
PS. I also noticed KOMG as a possible short after finishing this post. I'll try to post a chart tomorrow.
Sunday Night / Monday Morning Update
Posted by downtowntrader | 7/24/2006 12:43:00 AM | 1 comments »
Subscribe to:
Post Comments (Atom)


Hey Downtown Trader,
Just started my own blog at www.whammies.blogspot.com
I'm basically doing the same thing with my knowledge of technicals and stocks.
I was wondering if the ads for the blogger are worth putting on your site? Should I consider it or no? Give me some tips if you have some time.
Thanks, Chris