This is the difficult part of being a trader. Trying to determine if a drop like today's is signaling that a top has been reached or if this is all part of working off some overbought readings. Today's selling was definitely distribution, but then, that is also a part of normal behavior for markets. The key will be how the indices handle upcoming support levels and whether they will be breached without a fight. It is important to adhere to your stops and wait patiently for things to sort themselves out. I am posting updated charts of the four major indices tonight with certain trendlines drawn in.
First is the SP500. It should find support in the 1290-1295 area and if it doesn't, then that is a clear signal that all is not right with it.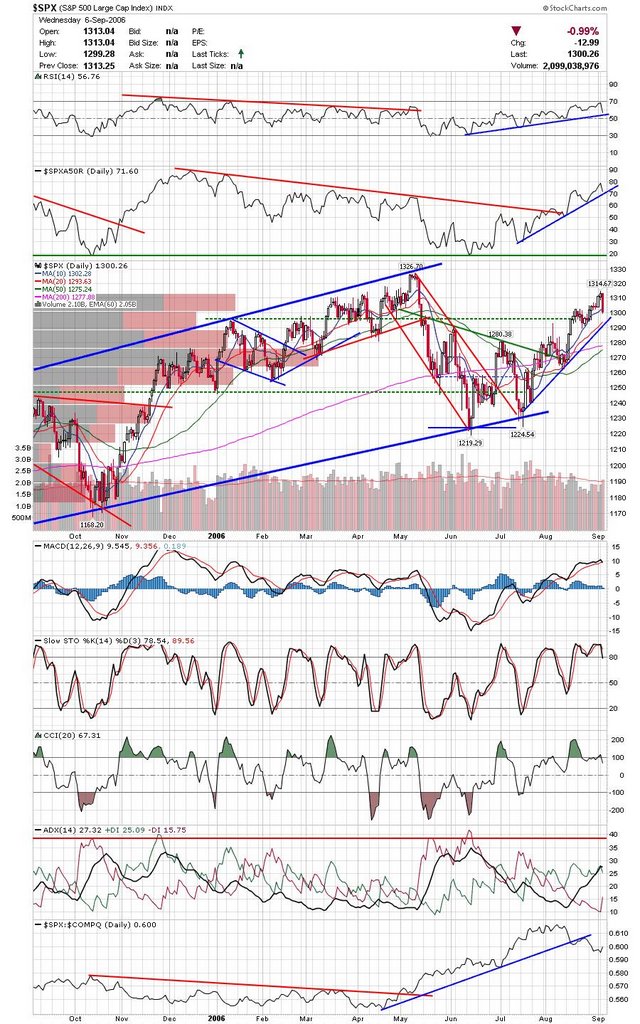 Next is the Russell. Today came close to invalidating the recent breakout and in fact, it may have. Keep an eye on whether it can reclaim the 200sma. My guess is that the best shorts for the next leg down will be small caps as they have been getting hit the hardest on down days.
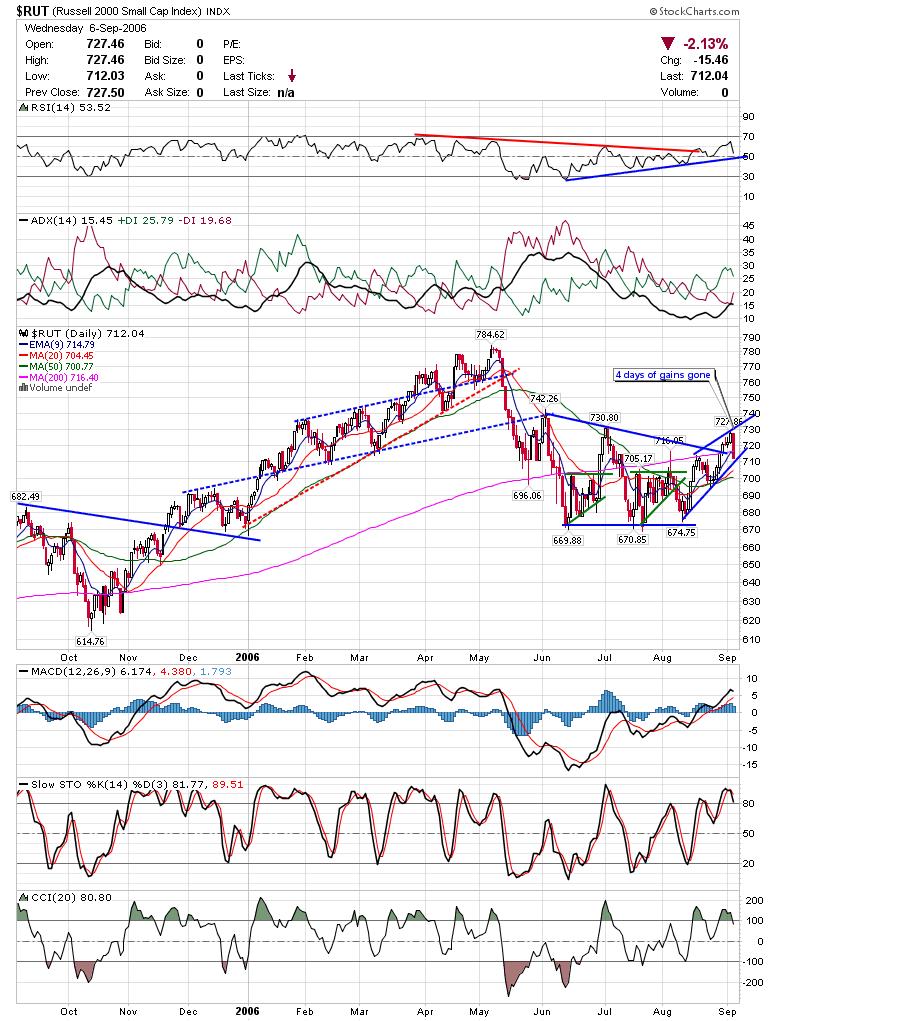 Here is the Nasdaq composite. Todays drop took it right to expected support. What you don't want to see is a few days consolidating near the bottom or under todays range. Notice Volatility getting close to a breakout. That would be bearish.
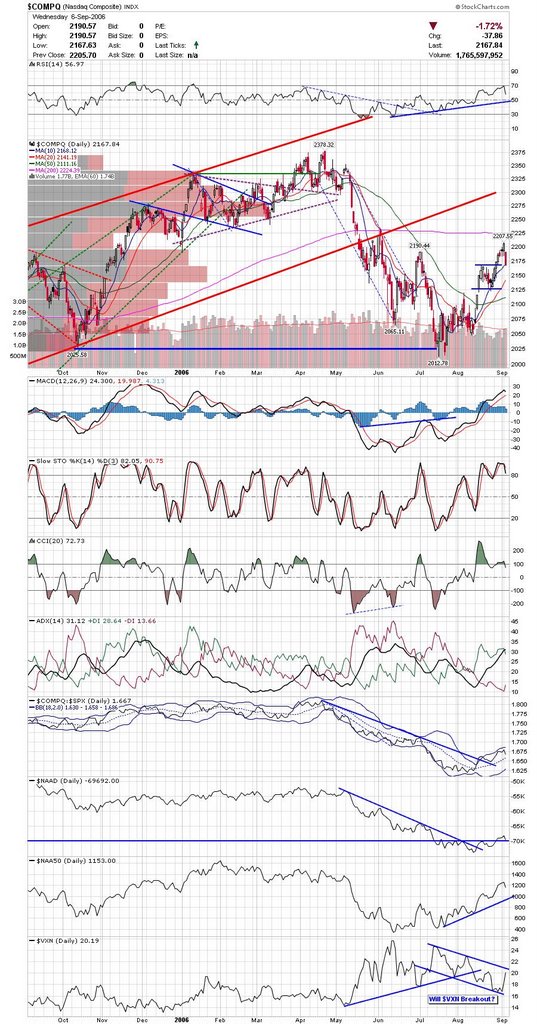 Here is the DJIA. This could be a bearish wedge breakdown and should probably be shorted if it breaks the trendline.
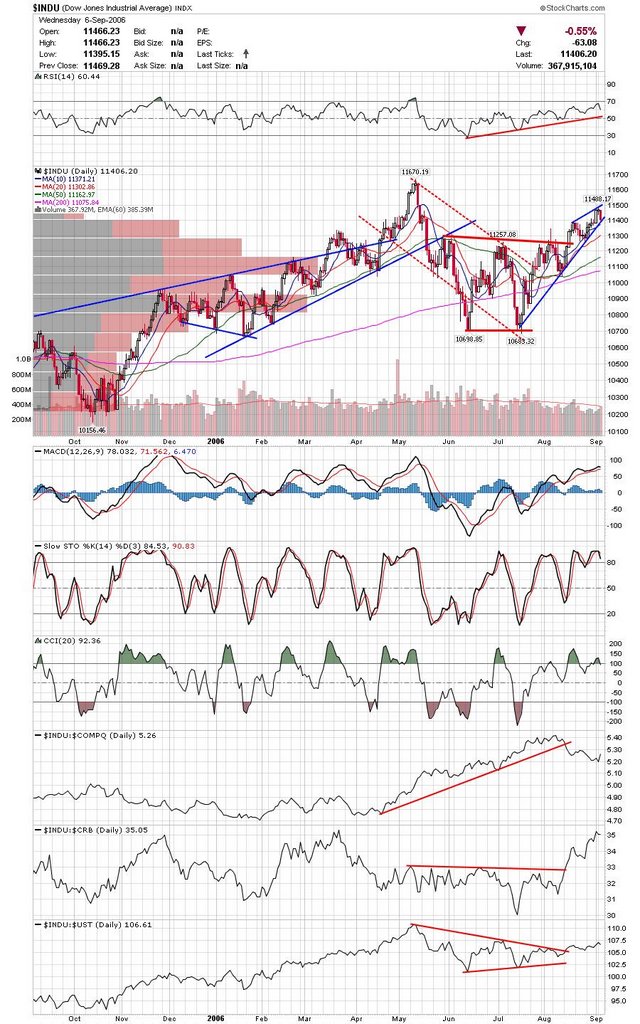 The thing that has been tripping me up lately, is while seasonal influences point down, and while the market internals are pointing down, and economic indicators are pointing down, the markets clearly formed some chart patterns that have yet to reach their targets. The key is what happens with volume and certainly that has been down lately.
Good Luck,
DT
Subscribe to:
Post Comments (Atom)


0 comments
Post a Comment