The markets had another decent move today with the DJIA just missing the 12K mark. While 12K doesn't really mean much, don't underestimate the power of big whole numbers and crowd psychology. Rather then post charts tonight, I figured I would change it up and post on how I use my charts.
Some of you may have noticed that I have changed my charts around recently. I have been tinkering around with my swing trading strategies in order to streamline them recently, and the result was removing some indicators from the charts, and changing things around a bit. Before I go through the charts, I would like to define the type of trader I am, as it should provide insight into why I post certain types of charts on my watchlist and not others.
I am a swing trader with an average hold time of 1-4 days. Most trades are closed in about 2.5 days. While I do hold longer in certain instances, I'm usually playing for one leg up or down. I have experimented with different time periods in the past, and I've found that when I try and hold for longer periods, I tend to get chopped on the pullbacks with my stops. I like to buy near a value area and sell on the breakout moves. I've tried breakout/breakdown trading and find that I get larger wins, but a lower success rate. I still trade breakouts if the setup is perfect though, but it is not my typical play. I also daytrade a gap momentum strategy, but we'll leave that for another post, as my bread and butter is the swing trade.
I call the strategy I use most, a breakout pullback, as I look for a stock that just made a pivot high and pulls back to support. My preference is for a breakout from a chart pattern followed by a pullback to retest the breakout area. The support can be a trendline, bollinger band, previous candle pattern or moving average support. I try to wait for confirmation that support is being respected and then jump on board as soon as it starts to move up. I try and get an entry close to support, so that not if, but when I'm wrong, it only costs me a small amount. I then sell at least a third when it starts to move towards my initial target to lock in a gain.
I decided to stick to the following indicators and discarded the rest.
- Price and Volume: Everything is a derivative of these two and therefore they are the most important
- Moving Averages: I use a few moving averages, but focus on the 9ema and 20sma for most of my trading decisions. I keep an eye on the 50 and 200sma's as institutions favor those.
- MACD: I use the MACD for divergences and for screening my decisions. I like for Histogram to tick in the direction of my trade before making the entry. This stops me from catching a falling knife.
- Bollinger bands: I like when trendlines and moving averages converge on a bollinger band sloping in the direction of my trade. I love when I get a double bottom on a BB.
- Price Channel: I use the price channel on a separate window to keep me honest at entering near value and when it is expensive.
- Stochastics: I like to use Slow stochastics as an additional confirmation and prefer to have it trend in the direction I am taking.
- PPO: I use a simple PPO to illustrate 3 and 6ma crossovers. It is simply used to warn me if I stay in a stock too long.
- RSI: I use RSI to spot divergences and to show overbought and oversold readings.
I don't use any indicator as a mechanical trigger. I only use them to provide clues and confirmations of price and volume. Beyond the above, I look to the weekly chart to screen my trades. I prefer the weekly to be in order and for either the 10sma to be ticking up or the MACD histogram to be ticking up. This is similar to Alexander Elders Impulse system for those familiar with it. I then look to the daily and use the 9 and MACD histogram in the same way. This is just another mechanism that forces me to be objective about any chart.
Here is a chart of a trade I recently took with some of the reasoning behind the trade. By the way, I have charts like this for most of my trades. I use them to analyze the thousands of mistakes I make and to note any improvements I could of made. It's amazing how much you can learn pouring over your mistakes.
Fuel Tech Inc. (Public, NASDAQ:FTEK)
Click on the chart to zoom.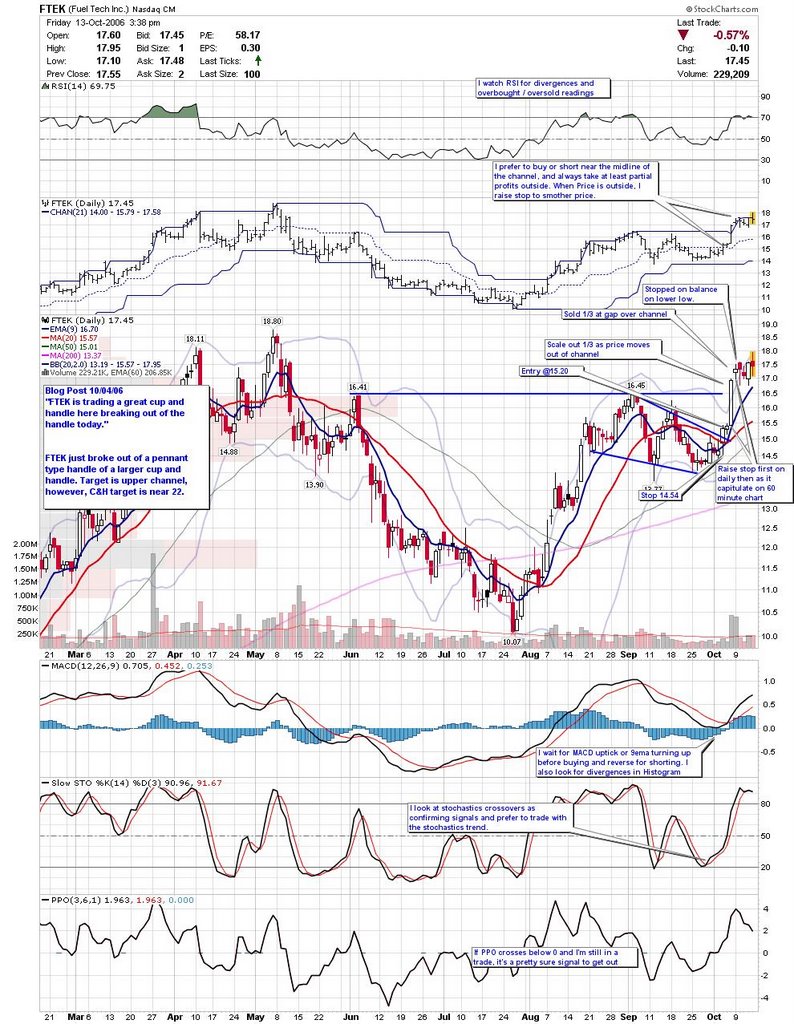
This setup is more of a general idea that has a few variances. There are pullbacks after 52weekhighs, pullbacks after a downtrend breakout, and mid-trend pullbacks, with each having different indicators I watch more closely. For instance, on a downtrend breakout, I like to see a little double bottom on the bollinger band. On 52week high stocks, I look more closely at RSI divergences. The key here, is to have a plan for your setups and then to stick to your trading methodology. After much trial and error, I have found this to be MY most reliable setup. I really improved as a Trader once I defined what I was trying to do, and threw out the rest. I think it's important to note that what works for me may not be what works best for anyone else. Every successful trader I know has a bread and butter setup they use that has been tweaked to their personality through years of trial and error. My suggestion to those struggling with trading is to focus on one setup, and start paper trading it. If it seems like something that agrees with your own unique trading persona, then try it exclusively for a few months in the real world.
Also, keep in mind that the trading strategy is only one part of a trading plan. Money Management is still by far the most important piece of the puzzle, but also the least exciting to write about ;) . If I rambled too much, or was unclear on something, please feel free to respond in the comments section.
DT


Great job DT!
It's interesting to compare notes with other traders.
Thanks.
Thanks for your strategy, very helpfull. Do you like the current setup on SMSI?
DT,
Thanks for sharing your methodology. I learn very much from other experienced traders.
Muaad
I can't read any of the comment boxes on the ftek chart. Can you post a higher res version or provide the comments as text rather than in the picture.
Thanks for the comments everyone.
Scott, SMSI continues to do well, but I wouldn't be chasing at these lofty levels.
Muaad, I will check it out.
Anon,
Clicking on any of the charts should zoom in on them.
DT