Stock Chart Analysis SPY
SPDR Trust, Series 1 (Public, AMEX:SPY)
First off, my thoughts are with the soldiers who have made the ultimate sacrifice protecting our country. Whether you support this war or not, think of the people who put their life on the line everyday. Happy Memorial Day.
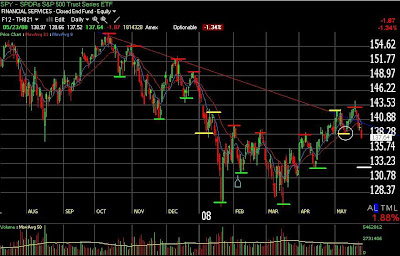
I decided to show very simple chart of the S&P500 ETF, SPY for a couple of reasons. First, the markets are in a tough spot to be initiating new positions for the type of trades I make, so I don't want to post any charts of stocks until I feel the odds are back in my favor. Second, I felt it was important to show that the markets are possibly breaking down without over complicating things with tons of indicators.
Looking at the SPY chart below, you will find only a couple of moving averages, and a trend line. I also highlighted the most recent pivot highs and lows, as the very definition of how a stock is trending is based on the highs and lows. An uptrend is simply when a stock is making higher highs and higher lows, and the reverse of course, for down trends. If you look at SPY you will notice that it was in a clear down trend from October through January. It then started trading sideways until appearing to breakout late in April. It then cleared a down trend line dating back to October, but then immediately reversing a few days later. I highlighted a couple of questionable pivot highs and lows, of which both were broken. The low was broken last Friday, and while this may not be an important pivot point that was broken, it does portend a test of the more significant low near 132. I would suspect a bounce over the coming days, but as long as price doesn't make a new high, it looks like SPY will ultimately test the low formed at 132.33.
Good Trading,
Joey
for more analysis, check out downtowntrader.com
Subscribe to:
Post Comments (Atom)


0 comments
Post a Comment